Environment & Energy
Related: About this forumExtreme global climate outcomes are possible even at 2C of warming
https://www.ufz.de/index.php?en=36336&webc_pm=14/2026Study led by UFZ highlights the need for ambitious climate mitigation measures
Extreme climate impacts on people and the environment are often associated with very high levels of global warming (3 or 4°C). A new study led by the Helmholtz Centre for Environmental Research (UFZ) shows that this assumption is too simplistic. Even moderate warming of 2°C could pose considerable climate risks for sectors that are particularly important for society and ecosystems. These include densely populated regions facing heavy rainfall, key agricultural areas affected by droughts, and forests exposed to extreme fire weather conditions. This underlines the urgency of rapid climate mitigation measures to limit these risks. The study has been published in Nature.
Because climate models still involve considerable uncertainties, it cannot be ruled out that the global climate could develop far more dramatically than expected. “In the interest of responsible risk assessment, we should therefore look beyond the most likely ranges projected by climate models and consider extreme outcomes that could have severe societal or environmental consequences”, says lead author and UFZ climate researcher Dr Emanuele Bevacqua. Until now, these worst-case “extreme global climate outcomes” have typically been described using the average results of many climate models at high levels of global warming (3 or 4°C). However, this approach does not take into account the fact that even at moderate levels of global warming, individual climate projections for certain regions can be very severe. “Furthermore, weather patterns in neighbouring regions tend to be strongly correlated, whereas those in distant regions are largely uncorrelated. This makes it difficult to infer global risks from local uncertainty estimates”, says co-author Prof Dr Jakob Zscheischler, climate researcher at the UFZ and Professor for Data Analytics in Hydro Sciences at TUD Dresden University of Technology.
The researchers therefore adopted a new approach for their study: they identified sector-specific drivers of climate impact such as precipitation extremes and droughts as well as regions where vulnerable sectors (e.g. forests, agriculture, and densely populated areas) are located. Combining these factors makes it possible to examine climate changes in locations where they are particularly relevant for specific global risks. For example, they analysed heavy rainfall in densely populated regions, droughts in major global agricultural regions, and fire-conducive weather in forests. To do this, they evaluated global simulations from many different climate models, which also form the basis of the reports of the Intergovernmental Panel on Climate Change (IPCC). In this way, they were able to identify the model projections that show the strongest (worst-case) and the weakest (best-case) outcomes respectively for each sector examined.
The key finding: for each of the three global domains examined (heavy rainfall in densely populated regions, droughts in global agricultural regions, and fire-conducive weather in forests), some individual climate model projections show considerably greater changes at 2°C of warming than the average across all models at 3°C or even 4°C. This is particularly evident in relation to food security, by focussing on growing regions that account for a large share of global production of maize, wheat, soy, and rice. In this area, the climate models show very large differences. Depending on the model, the frequency of droughts at 2°C of warming may remain unchanged or increase by more than 50%. “At 2°C, 10 of the 42 models examined produce a drought increase that is considerably above the model average at 4°C of warming”, says Bevacqua. The risk of droughts in globally important growing regions is therefore much higher than would be expected from an analysis of model averages. Given their importance for food security, global supply chains, and international markets, the consequences of such extreme climate developments need to be examined more closely. In the domains ‘heavy rainfall in densely populated regions’ and ‘extreme fire weather in forested areas’, the worst-case models at 2°C also show climate trends that exceed the average changes at 3°C of warming.
…
 = new reply since forum marked as read
Highlight:
NoneDon't highlight anything
5 newestHighlight 5 most recent replies
= new reply since forum marked as read
Highlight:
NoneDon't highlight anything
5 newestHighlight 5 most recent replies

OKIsItJustMe
(21,875 posts)www.atmos-chem-phys.net/16/3761/2016/
doi:10.5194/acp-16-3761-2016
© Author(s) 2016. CC Attribution 3.0 License.
Ice melt, sea level rise and superstorms: evidence from paleoclimate data, climate modeling, and modern observations that 2 °C global warming could be dangerous
…
Received: 11 June 2015 – Published in Atmos. Chem. Phys. Discuss.: 23 July 2015
Revised: 17 February 2016 – Accepted: 18 February 2016 – Published: 22 March 2016
Abstract. We use numerical climate simulations, paleoclimate data, and modern observations to study the effect of growing ice melt from Antarctica and Greenland. Meltwater tends to stabilize the ocean column, inducing amplifying feedbacks that increase subsurface ocean warming and ice shelf melting. Cold meltwater and induced dynamical effects cause ocean surface cooling in the Southern Ocean and North Atlantic, thus increasing Earth’s energy imbalance and heat flux into most of the global ocean’s surface. Southern Ocean surface cooling, while lower latitudes are warming, increases precipitation on the Southern Ocean, increasing ocean stratification, slowing deepwater formation, and increasing ice sheet mass loss. These feedbacks make ice sheets in contact with the ocean vulnerable to accelerating disintegration. We hypothesize that ice mass loss from the most vulnerable ice, sufficient to raise sea level several meters, is better approximated as exponential than by a more linear response. Doubling times of 10, 20 or 40 years yield multi-meter sea level rise in about 50, 100 or 200 years. Recent ice melt doubling times are near the lower end of the 10–40-year range, but the record is too short to confirm the nature of the response. The feedbacks, including subsurface ocean warming, help explain paleoclimate data and point to a dominant Southern Ocean role in controlling atmospheric CO₂, which in turn exercised tight control on global temperature and sea level. The millennial (500–2000-year) timescale of deep-ocean ventilation affects the timescale for natural CO₂, change and thus the timescale for paleo-global climate, ice sheet, and sea level changes, but this paleo-millennial timescale should not be misinterpreted as the timescale for ice sheet response to a rapid, large, human-made climate forcing. These climate feedbacks aid interpretation of events late in the prior interglacial, when sea level rose to +6–9 m with evidence of extreme storms while Earth was less than 1 ◦C warmer than today. Ice melt cooling of the North Atlantic and Southern oceans increases atmospheric temperature gradients, eddy kinetic energy and baroclinicity, thus driving more powerful storms. The modeling, paleoclimate evidence, and ongoing observations together imply that 2 °C global warming above the preindustrial level could be dangerous. Continued high fossil fuel emissions this century are predicted to yield (1) cooling of the Southern Ocean, especially in the Western Hemisphere; (2) slowing of the Southern Ocean overturning circulation, warming of the ice shelves, and growing ice sheet mass loss; (3) slowdown and eventual shutdown of the Atlantic overturning circulation with cooling of the North Atlantic region; (4) increasingly powerful storms; and (5) non-linearly growing sea level rise, reaching several meters over a timescale of 50–150 years. These predictions, especially the cooling in the Southern Ocean and North Atlantic with markedly reduced warming or even cooling in Europe, differ fundamentally from existing climate change assessments. We discuss observations and modeling studies needed to refute or clarify these assertions.
1 Introduction
Humanity is rapidly extracting and burning fossil fuels without full understanding of the consequences. Current assessments place emphasis on practical effects such as increasing extremes of heat waves, droughts, heavy rainfall, floods, and encroaching seas (IPCC, 2014; USNCA, 2014). These assessments and our recent study (Hansen et al., 2013a) conclude that there is an urgency to slow carbon dioxide (CO₂ ) emissions, because the longevity of the carbon in the climate system (Archer, 2005) and persistence of the induced warming (Solomon et al., 2010) may lock in unavoidable, highly undesirable consequences.
Despite these warnings, fossil fuels remain the world’s primary energy source and global CO₂ emissions continue at a high level, perhaps with an expectation that humanity can adapt to climate change and find ways to minimize effects via advanced technologies. We suggest that this viewpoint fails to appreciate the nature of the threat posed by ice sheet instability and sea level rise. If the ocean continues to accumulate heat and increase melting of marine-terminating ice shelves of Antarctica and Greenland, a point will be reached at which it is impossible to avoid large-scale ice sheet disintegration with sea level rise of at least several meters. The economic and social cost of losing functionality of all coastal cities is practically incalculable. We suggest that a strategy relying on adaptation to such consequences will be unacceptable to most of humanity, so it is important to understand this threat as soon as possible.
We investigate the climate threat using a combination of atmosphere–ocean modeling, information from paleoclimate data, and observations of ongoing climate change. Each of these has limitations: modeling is an imperfect representation of the climate system, paleo-data consist mainly of proxy climate information usually with substantial ambiguities, and modern observations are limited in scope and accuracy. However, with the help of a large body of research by the scientific community, it is possible to draw meaningful conclusions.
…

NNadir
(37,986 posts)OKIsItJustMe
(21,875 posts)NNadir
(37,986 posts)I have very little patience, obviously, for whining about climate collapse while ignoring the cause.
However, there is not an exclusive choice between burning coal or nuclear fission, which you steadfastly refuse to acknowledge.
NNadir
(37,986 posts)...power plants.
The big lie that flies around among antinukes and "I'm not an antinuke" antinukes is that solar and wind crap, which has such low capacity utilization, well under 40% generally - not that this stops antinukes from insipidly and dishonestly stating nameplate capacity for this junk in units of power, Watts, as opposed to units of energy, Joules, - is a viable alternative to coal, about which they generally don't give a shit.
If one is interested in the cause of climate collapse, as opposed to whining about it, one could look up figures for capacity utilization.
I have.
Of course, I don't just pretend to care about the climate collapse, I do the necessary homework.
Have a nice afternoon.
OKIsItJustMe
(21,875 posts)I have presented several tables from the IEA (and others) which you simply ignore. You only read things that you feel support your extremist view.
Nuclear fission has a role to play in the future power system as it does in the current system. It will not be the sole source of electrical power. We cannot afford to wait for a sufficient number of fission (or fusion) plants to be built. We need to cut emissions today, not in some indefinite future.
So, by all means, let’s build those Gen. IV reactors. In the meantime, let’s continue to deploy technologies that work and are quickly being deployed today.
NNadir
(37,986 posts)...soothsaying in the tables.
I have been extremely clear about this, but am often ignored by people who can't figure out whether 18 (9+9) is bigger than 31.
I have every fucking World Energy Outlook in my files going back to the dawn of this century. For the whole time I've been collecting these, the rate of collapse of the planetary atmosphere has been accelerating, with positive second, and even third derivatives.
If nuclear is not the sole source of electrical energy it is because people keep carrying on - dishonestly - about what is faster to build.
The tables of historical data from the IEA shows quite clearly, that the multi trillion dollar solar and wind scam, in units of energy, again the Joule, not the Watt has failed to produce as many Joules as nuclear energy has been producing for decades.
I have the IEA tables from the 2025 WEO handy, covering, again, historical data, and of course, soothsaying, which again, I don't credit.
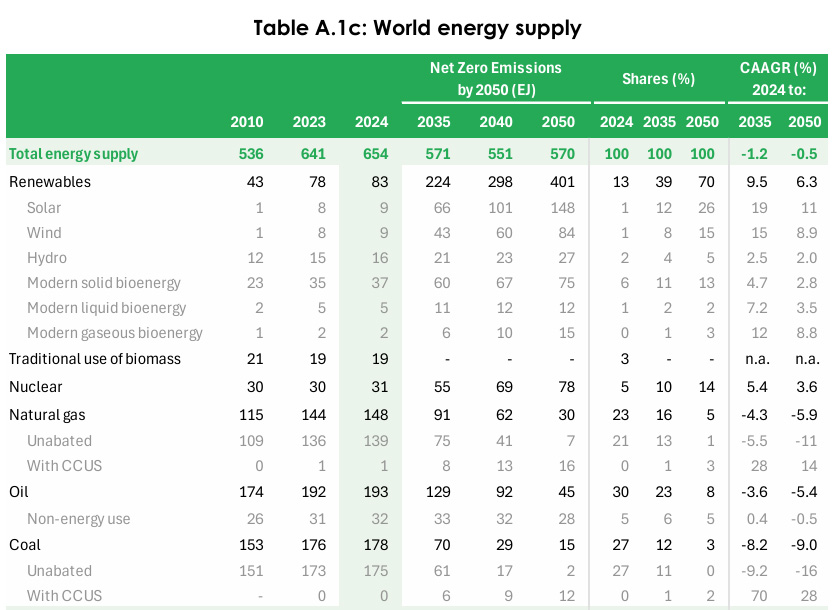
World Energy Outlook 2025 Page 420.
Let me know, again, if I am required to believe that 9 + 9 is greater than 31.
The bullshit idea that it is faster to build wind and solar junk than it is to build nuclear is another pernicious lie put forth by antinukes and "I'm not an antinuke" antinukes.
Another real whopper is "nuclear is too expensive" as if the collapse of the planetary atmosphere is cheap.
I note that the number 31 attached to the unit of energy, the Exajoule, for nuclear production in 2024, has been achieved in an atmosphere of insipid demonization and carrying on, while the two numbers 9 and 9 for wind and solar each took place in an orgy of expensive wishful thinking and mindless cheering.
It obviously takes way too long for solar and wind junk to produce meaningful energy, even at a price now approaching a trillion dollars a year. If, however, one is merely concerned with the speed of build, it is true that it is relatively fast to build dangerous fossil fuel powered plants, which strikes me as fine with antinukes and "I'm not an antinuke" antinukes, since I see no evidence at all they give a shit about fossil fuels, on which, by the way, so called "renewable energy" depends. They are certainly rushing to build gas powerplants in Germany albeit with bullshit rhetoric how they could run them on hydrogen, hydrogen being a rebrand of fossil fuels, from which hydrogen is overwhelmingly made, at a cost of exergy destruction.
Germany says new gas power plants will be online by 2031 following EU deal
Lovely, just lovely.
I would hope that people whining about the collapse of the planetary atmosphere while bad mouthing nuclear energy would get serious, but thus far there is no evidence that they will.
By the way, speaking of reports, the final report on the recent collapse of the electrical system in Spain and Portugal is out. One can download it. I would suggest using the text searching function to find the word "inverter" in the report. It's an illuminating discussion of the unfortunate darkness on the Iberian peninsula.
Final Report, April 28, 2005 Iberian blackout.
The word "inverter" occurs 144 times.
Have a nice day.
OKIsItJustMe
(21,875 posts)Executive summary
…
Renewables and efficiency are key to drive fossil fuel demand down
Tripling global installed renewables capacity to 11 000 gigawatts by 2030 provides the largest emissions reductions to 2030 in the NZE Scenario. Renewable electricity sources, in particular solar PV and wind, are widely available, well understood, and often rapidly deployable and cost effective. Current policy settings already put advanced economies and China on track to achieve 85% of their contribution to this global goal, but stronger policies and international support are required in other emerging market and developing economies. For all countries, speeding up permitting, extending and modernising electricity grids, addressing supply chain bottlenecks, and securely integrating variable renewables are critical.
Doubling the annual rate of energy intensity improvement by 2030 in the NZE Scenario saves the energy equivalent of all oil consumption in road transport today, reduces emissions, boosts energy security and improves affordability. Although the mix of priorities will differ by country, at the global level energy intensity improvements stem from three equally important actions: improving the technical efficiency of equipment such as electric motors and air conditioners; switching to more efficient fuels, in particular electricity, and clean cooking solutions in low-income countries; and using energy and materials more efficiently.
These two actions reduce fossil fuel demand, enabling continued adherence to a key milestone of our 2021 report: an immediate end to new approvals of unabated coal plants.
…
IEA (2023), Net Zero Roadmap: A Global Pathway to Keep the 1.5 °C Goal in Reach, IEA, Paris https://www.iea.org/reports/net-zero-roadmap-a-global-pathway-to-keep-the-15-c-goal-in-reach, Licence: CC BY 4.0
NNadir
(37,986 posts)...wants to talk about "reading" having a little critical thinking to evaluate it would be wise.
A good idea for developing critical thinking skills would include, to reiterate, the aforementioned distinction between units of power and units of energy.
As for soothsaying, there is no evidence, none, that so called "renewable energy" has anything to do with addressing fossil fuels. It's firmly established merely by looking at data.
OKIsItJustMe
(21,875 posts)MARCH 2, 2026
China’s Fossil Fuel Emissions Dropped Last Year as Solar Boomed
In China, the world’s leading carbon emitter, a massive buildout of solar power is beginning to push coal into decline. Last year China saw its fossil fuel emissions drop, even as demand for energy rose.
Emissions from energy and industry dropped by 0.3 percent in 2025, while consumption of energy rose by 3.5 percent, according to official statistics. Last year, renewables supplied 40 percent of power in China, up from 37 percent the previous year, with solar accounting for most of the growth. The added renewable power more than met the uptick in demand, and as a result, coal power fell slightly.
Breaking: China's official statistics report a 0.3% drop in CO2 emissions from energy&industry in 2025, the third time that annual emissions have fallen this century and the first fall predominantly driven by clean energy growth. 🧵
— Lauri Myllyvirta (@laurimyllyvirta.bsky.social) 2026-02-28T06:07:18.899Z
“This is an encouraging signal, as it suggests that the sort of large-scale energy transition which China has been investing heavily in has begun to translate into measurable outcomes,” said Duo Chan, a climate scientist at the University of Southampton. “Whilst one year of lower emissions does not mean that the climate challenge is solved, the scale of China’s deployment of renewables can lead us to hope that this may be the start of a sustained decline in its emissions.”
Analysts believe that China is planning for further declines in coal power. As renewables ramp up, it has begun retrofitting its fleet of coal plants to serve as a complement to wind and solar, rather than as a source of baseload power. Increasingly, coal generators will act as “peaker” plants, meeting spikes in power demand or gaps in the supply of wind and solar.
…
NNadir
(37,986 posts)...in a country that is building nuclear plants at a rate not seen since the 20th century in the United States and in France, is inherently dishonest.
In this century, China has brought 61 nuclear reactors on line, and has 38 under construction. Their reactors can run day or night, on windy days and on still days.
Of course, one is free to claim something about "narratives" and bias, but it might be wise to consider whether this is a pot and kettle case.
I have already made clear that nuclear energy, in China, and everywhere else on Earth for that matter, has a far higher capacity utilization than solar and wind junk.
OKIsItJustMe
(21,875 posts)You simply ignore evidence that does not support your beliefs.
NNadir
(37,986 posts)...to a massive rate of building nuclear powerplants, not seen on this planet since the 20th century in the United States and France.
Attributing the reductions to unreliable energy, with a low capacity factor and thus incapable of addressing coal use, solar energy, is dishonest, and is an effort to deny evidence.
The data on the construction of nuclear power plants in China is publicly available:
Reactor database, China
The link gives the 2024 output of China's nuclear plants: 417,518 GWh. Note that this is a unit of energy, not power. It translates in SI units to 1.5 Exajoules of electricity, and a primary energy output, given that most of these plants are Rankine devices with an efficiency of roughly 33%, 4.6 Exajoules of primary energy.
In percent talk this primary energy is over 50% of the energy provided by all of the solar facilities on the planet as of 2024, as reported in post #9 with respect to the WEO data tables found on page 420 of the 2025 WEO.
I've been a working scientist for 40 years, and I don't need a lecture on the topic of evidence and data from hand wavers and dreamers, particularly when they demonstrate no ability to understand numbers.
Feel free to get back to me on the question of whether 9 + 9 = 18 is greater than 31.
NNadir
(37,986 posts)From the data at the link in that post, one can calculate that the capacity utilization of nuclear plants in China is 79%, a figure lower than that of the United States, but probably attributable to the fact that the new reactors coming on line last year did not operate for a full year.
The reactors in question are Fangchenggang 4, connected to the grid in April of 2024, Shidaowan Guohe One 1, connected to the grid in October of 2024, and Zhangzhou 1, connected to the grid in November of 2024.